Nagios 4.1.1: Adding Nagios graphs to Nagios Core services
Nagios
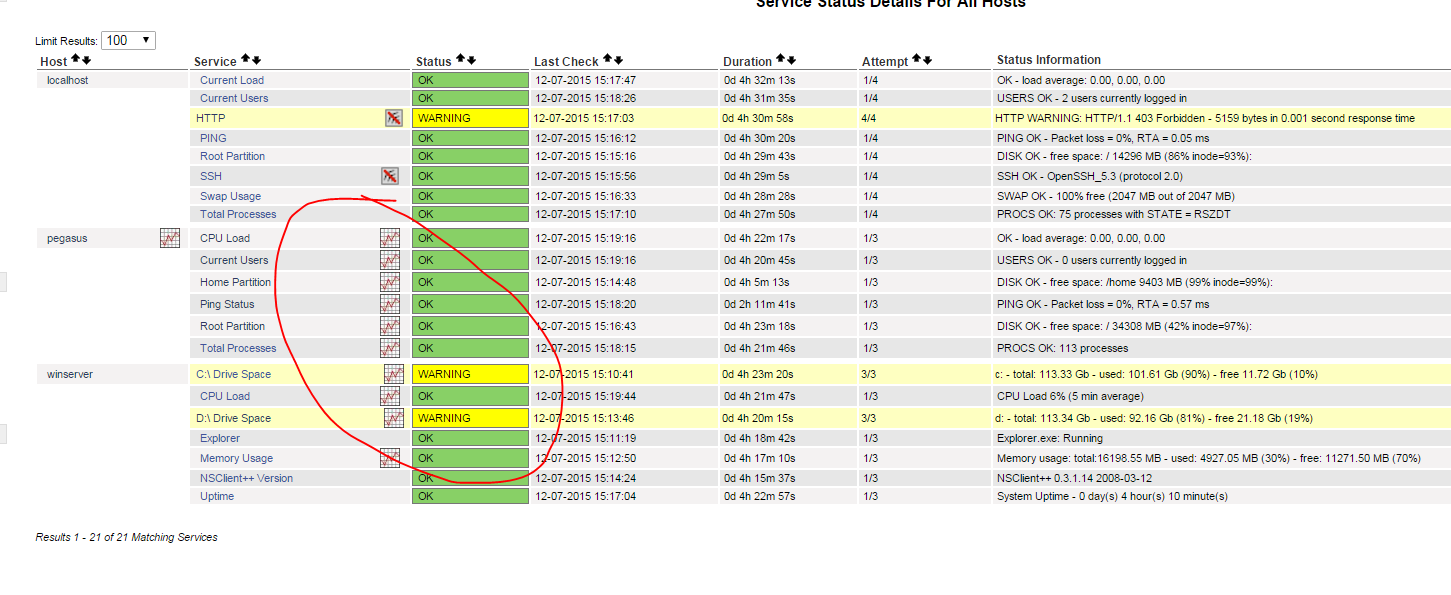
Adding graphs to the Nagios server will allow monitoring the services and hosts performance in the past, these graphs can be monitored for Day, week, Month and Yearly
Assuming that you have already configured the Nagios 4.1.1 Core Server if not follow this link to configure http://srsystemadminscripts.blogspot.in/2015/12/nagios-411-nagios-core-411-installation.html
Create a folder for the source:
# mkdir -p /usr/local/src/nagiosgraph
# cd nagiosgraph
Download the latest version:
# wget http://downloads.sourceforge.net/project/nagiosgraph/nagiosgraph/1.5.2/nagiosgraph-1.5.2.tar.gz
# tar -xf nagiosgraph-1.5.2.tar.gz
# cd nagiosgraph
Installing the dependencies for Nagios Graphs in Nagios server
#
#
Configure Nagios::
# perl
Press enter for all the prompts till we get
Press enter for all the prompts till we get cpan [
Check that we have all the dependencies installed:
# ./install . pl prereq
Output:
Carp...
CGI...
Data:: ...
Digest:: ...
File:: ...
File:: ...
MIME:: ...
POSIX...
Time:: ...
GD...
Start the installation:
# ./install . pl nagiosgraph
Give the default answer to all the questions except the below one:
Modify the Nagios configuration? [n] y
Modify the Apache configuration? [n] y
Create the Apache configuration file at this location "/usr/local/nagiosgraph /etc /", so that we can get the Nagios graphs from url, below are the commands to create the file and edit with the below contents.
# touch /usr/local/nagiosgraph etc nagiosgraph . conf
# vi nagiosgraph etc nagiosgraph . conf
Add the following to the file:
# enable nagiosgraph CGI scripts
ScriptAlias /nagiosgraph/cgi-bin "/usr/local/nagiosgraph/cgi"
<Directory "/usr/local/nagiosgraph/cgi">
Options ExecCGI
AllowOverride None
Require all granted
AuthName "Nagios Access"
AuthType Basic
AuthUserFile /usr/local/nagios/etc/htpasswd.users
Require valid-user
Order allow,deny
Allow from all
</Directory>
# enable nagiosgraph CSS and JavaScript
Alias /nagiosgraph "/usr/local/nagiosgraph/share"
<Directory "/usr/local/nagiosgraph/share">
Options None
AllowOverride None
Require all granted
# Require host 127.0.0.1
AuthName "Nagios Access"
AuthType Basic
AuthUserFile /usr/local/nagios/etc/htpasswd.users
Require valid-user
Order allow,deny
Allow from all
</Directory>
Restart Nagios and Apache:
# service nagios
# service apache2 restart
You can now view the graphs at https://you-ip-address/nagiosgraph/cgi-bin/show.cgi.

We can integrate these graphs into Nagios with a little hack. Nagios a
We can also place a javascript url to the graphs there. Place this inside any service check: in windows.cfg, localhost.cfg, services.cfg files which are located in /usr/local/nagios etc
action_url /nagiosgraph/cgi-bin/show.cgi?host=$HOSTNAME$&service=$SERVICEDESC$&geom=1000x200' onMouseOver='showGraphPopup(this)' onMouseOut='hideGraphPopup()' rel='/nagiosgraph/cgi-bin/showgraph.cgi?host=$HOSTNAME$&service=$SERVICEDESC$
For example, the Load of the system:
# vi nagios
host_name localhost
service_description Load
check_command check_local_load!
action_url /nagiosgraph/cgi-bin/show.cgi?host=$HOSTNAME$&service=$SERVICEDESC$&geom=1000x200' onMouseOver='showGraphPopup(this)' onMouseOut='hideGraphPopup()' rel='/nagiosgraph/cgi-bin/showgraph.cgi?host=$HOSTNAME$&service=$SERVICEDESC$
}
For the ping check you can show both RTA and packet loss:
host_name localhost
service_description PING
check_command check_ping! !
action_url /nagiosgraph/cgi-bin/show.cgi?host=$HOSTNAME$&service=$SERVICEDESC$&db=pl,data&db=pl,warn&db=pl,crit&geom=1000x200' onMouseOver='showGraphPopup(this)' onMouseOut='hideGraphPopup()' rel='/nagiosgraph/cgi-bin/showgraph.cgi?host=$HOSTNAME$&service=$SERVICEDESC$&db=pl,data&db=pl,warn&db=pl,crit
We need to include the Nagios Graph Javascript in Nagios to make sure the mouseover
# vim /usr/local/nagios ssi . ssi
Place the following in there:
<script nagiosgraph nagiosgraph . js
Now save and reload Nagios:
# service nagios

Nagios
Installing Nagios Core 4.1.1 on Centos 6.7Adding Nagios Linux host to

Comments
Post a Comment